Documentation on formulas is available via Functions library. For more complementary information, it is possible to see below how to:
Use filters instead of formulas
For example, a boolean can be computed either through a classic formula or by using filters.
The goal is to return true when:
- The instance name contains test, and
- The Countries n-n association includes Brazil or Belgium.
Use a formula
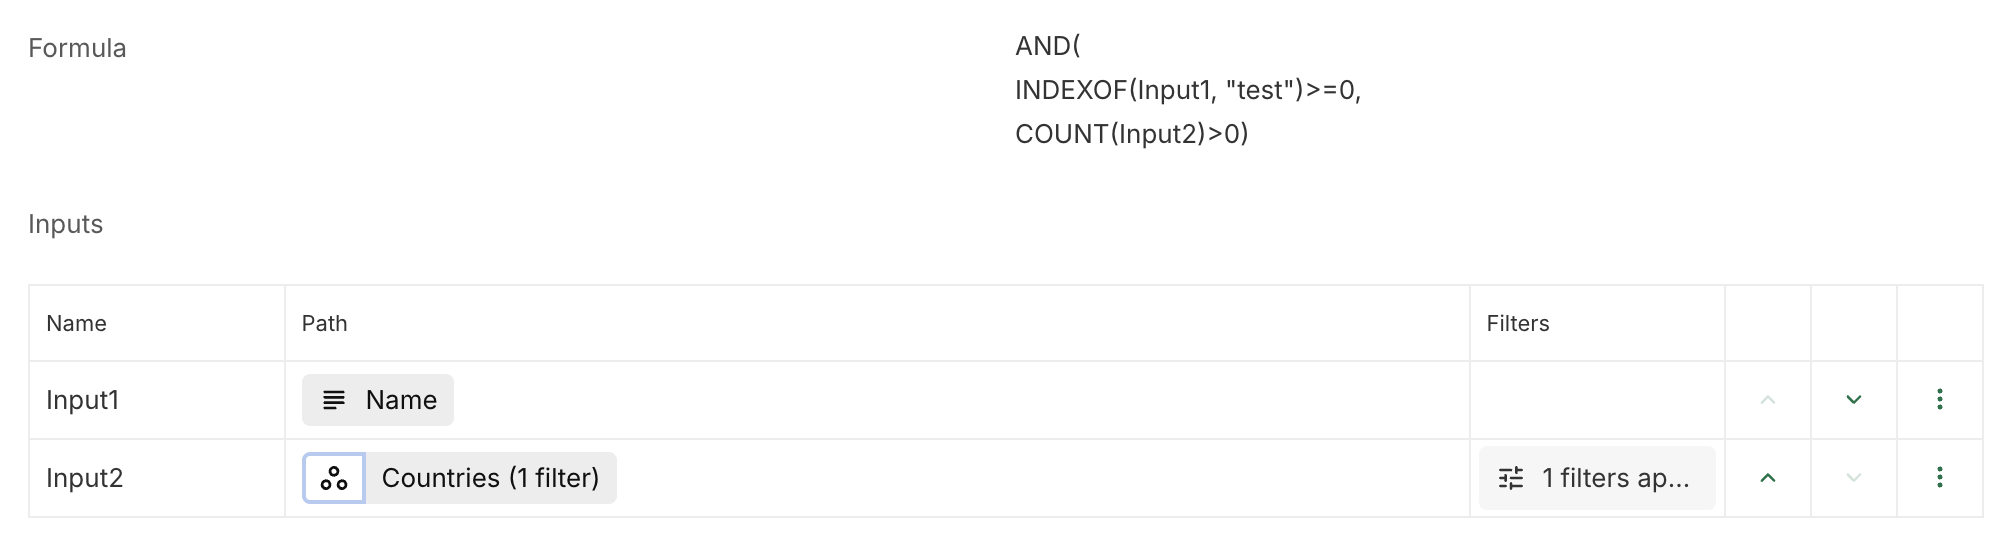
Use filters
- Create a computed n-1 association with the same concept
A technical n-1 association that simply references the instance:
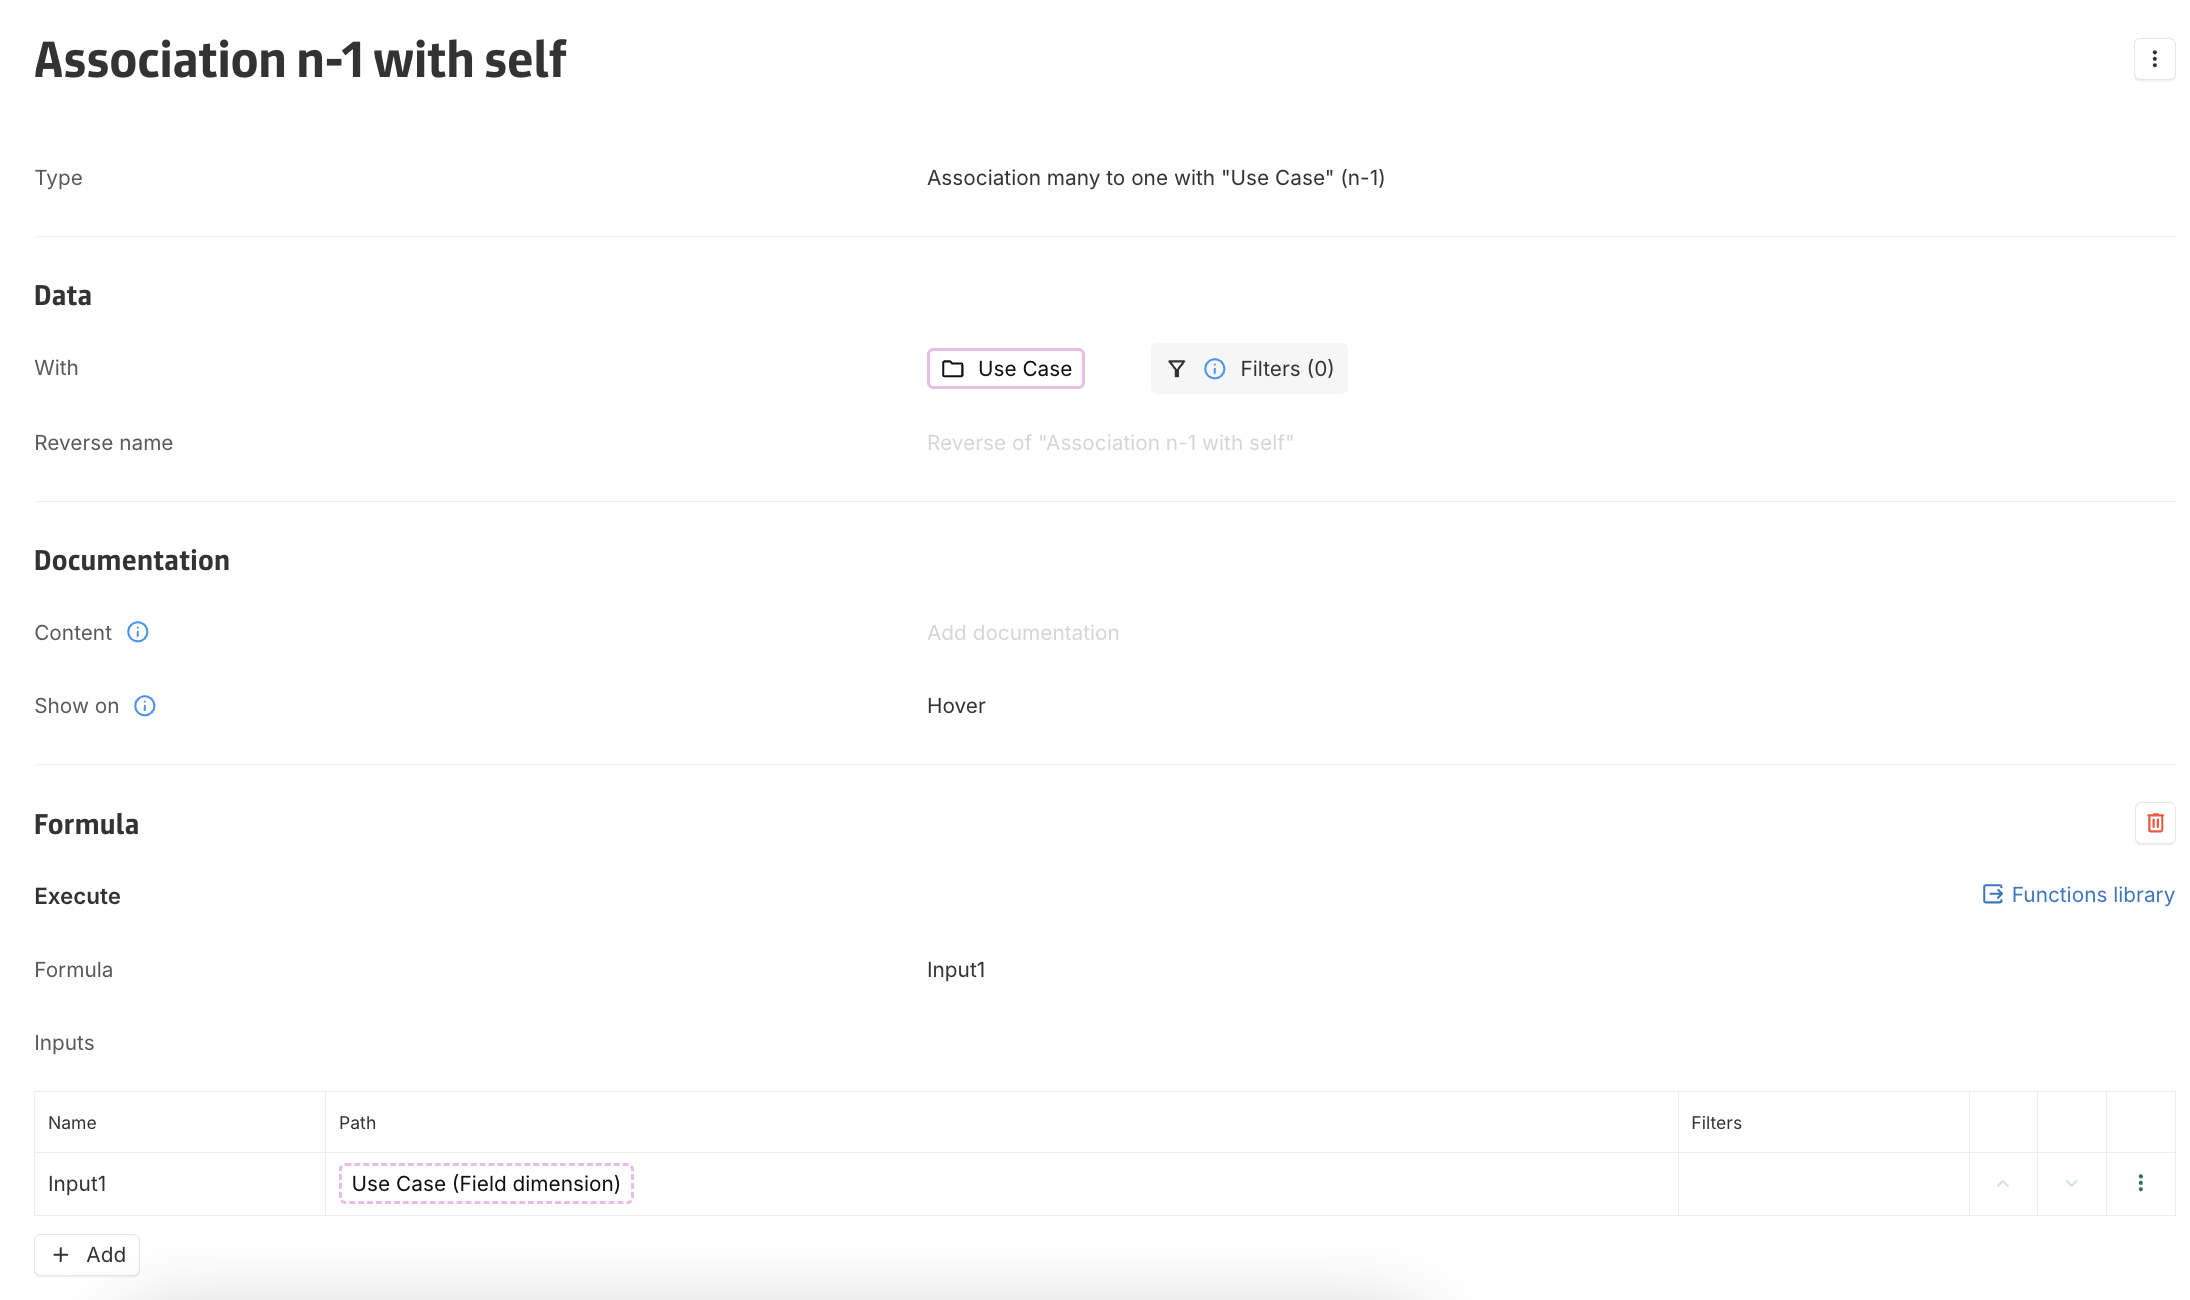
Computed n-1 association referencing the instance itself.
- Create the boolean with filters
- Use the computed association with self as the base for the boolean.
- Apply filters on this association to check if the instance satisfies the conditions
- Use the result of these filters to compute the boolean. The boolean evaluates to
trueif the filtered set is non-empty.
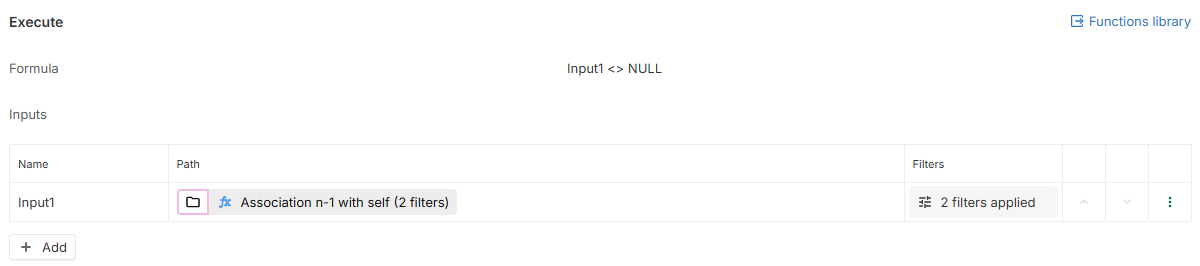
Boolean based on the computed association. 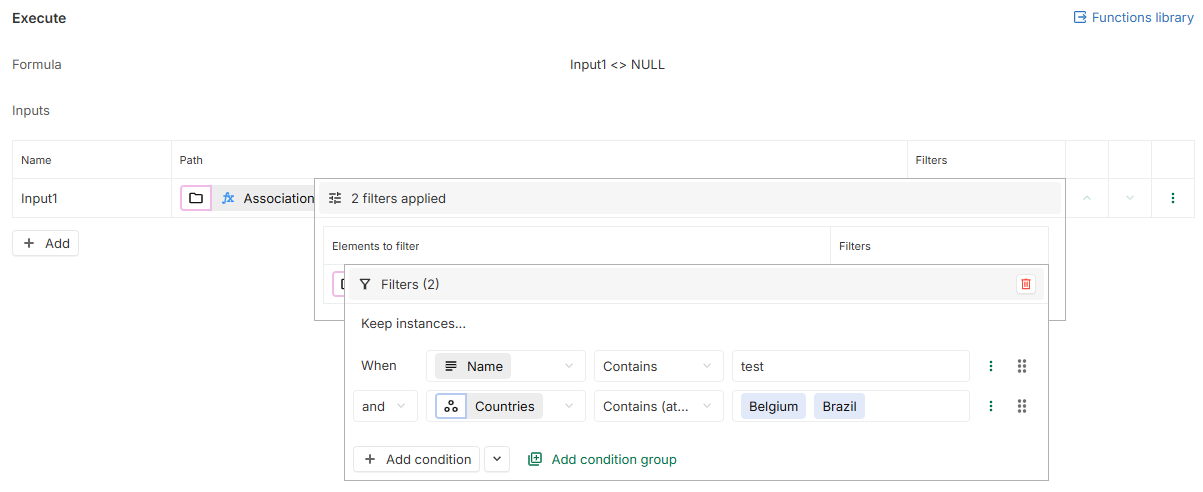
Filters applied to the computed association.
Check whether an input is null
To check if an input is NULL, it is possible to simply do:
Input1=NULLFor text inputs, it is better to use the ISBLANK function as a text can be NULL or empty for computed text ("").
Check the value of an association
Association n-1 and Workflow
Check whether the value is one of several instances
To check if Impacts status (Association n-1) is At Risk or All good, a filter needs to be set on the input:

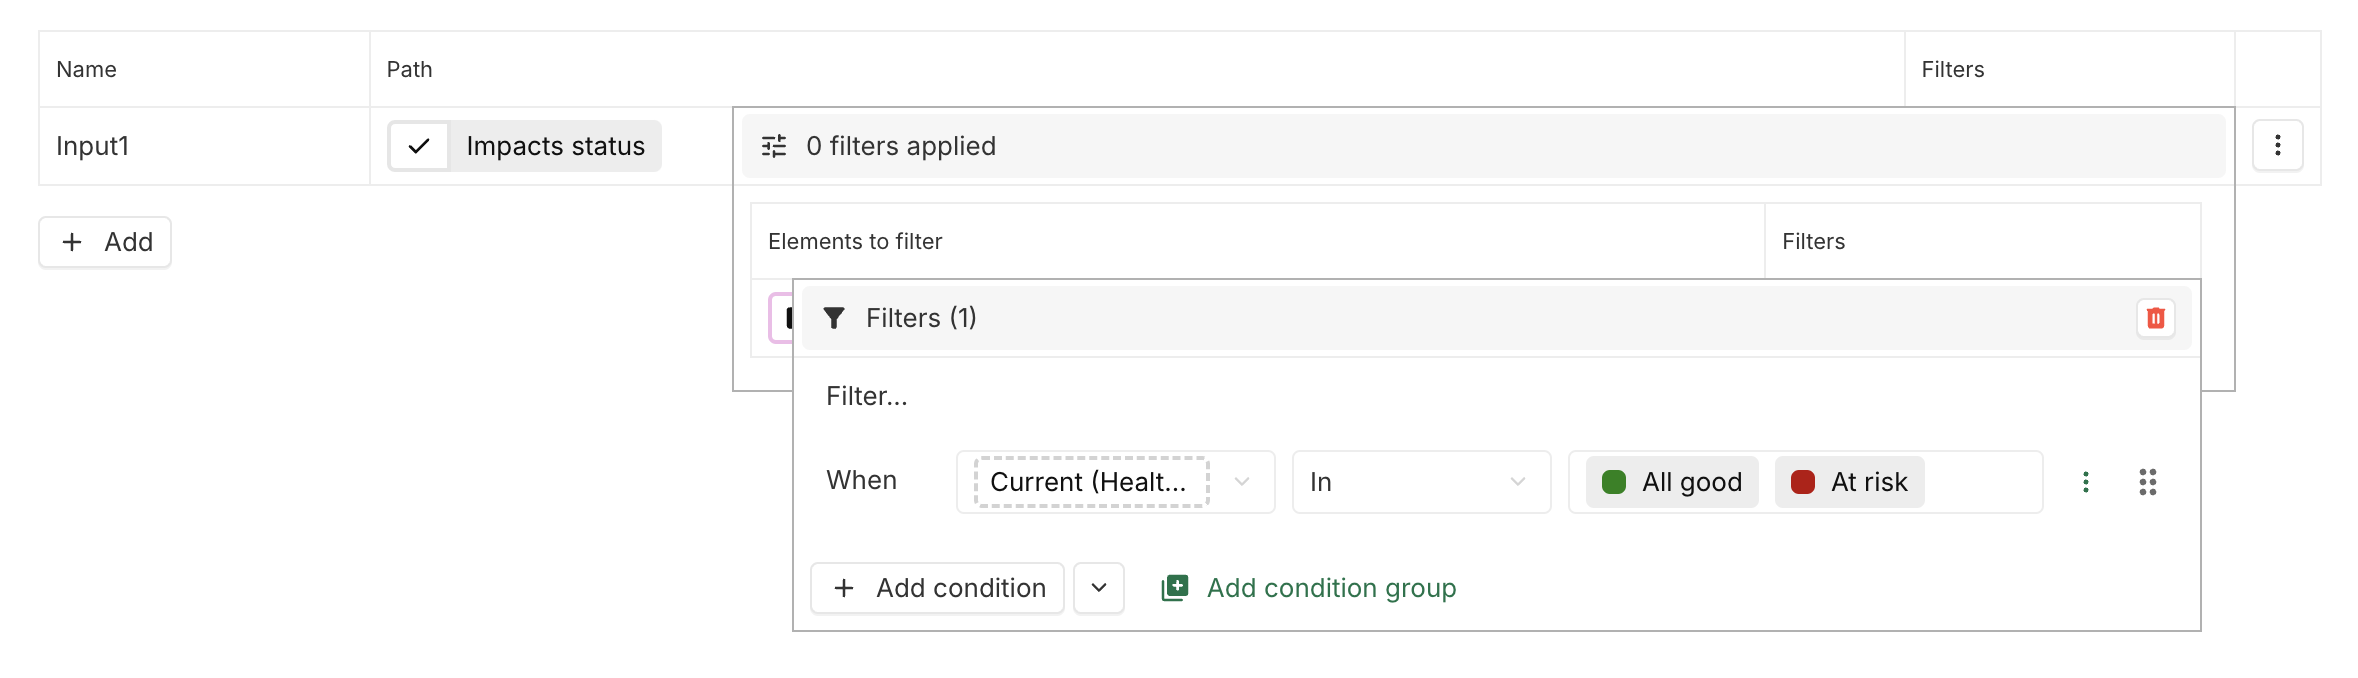
The count of instances in Input1 can then be used:
IF(COUNT(Input1)=1, DoSomething, DoSomethingElse)Check whether the value is a specific instance
To check if Impacts status (Association n-1) is At Risk, a filter can be set in the input, and then COUNT can be used as above. However, for this particular case, an optimization can be done: it is possible to define a second input which is the instance At Risk:

And then compare Input1 to this instance:
IF(Input1=Input2, DoSomething, DoSomethingElse)Association 1-n and n-n
Check whether the value contains at least one or several instances
To check if the field Data domain (Association n-n) contains at least the instance Customer & Sales Activation, a filter needs to be set on the input:

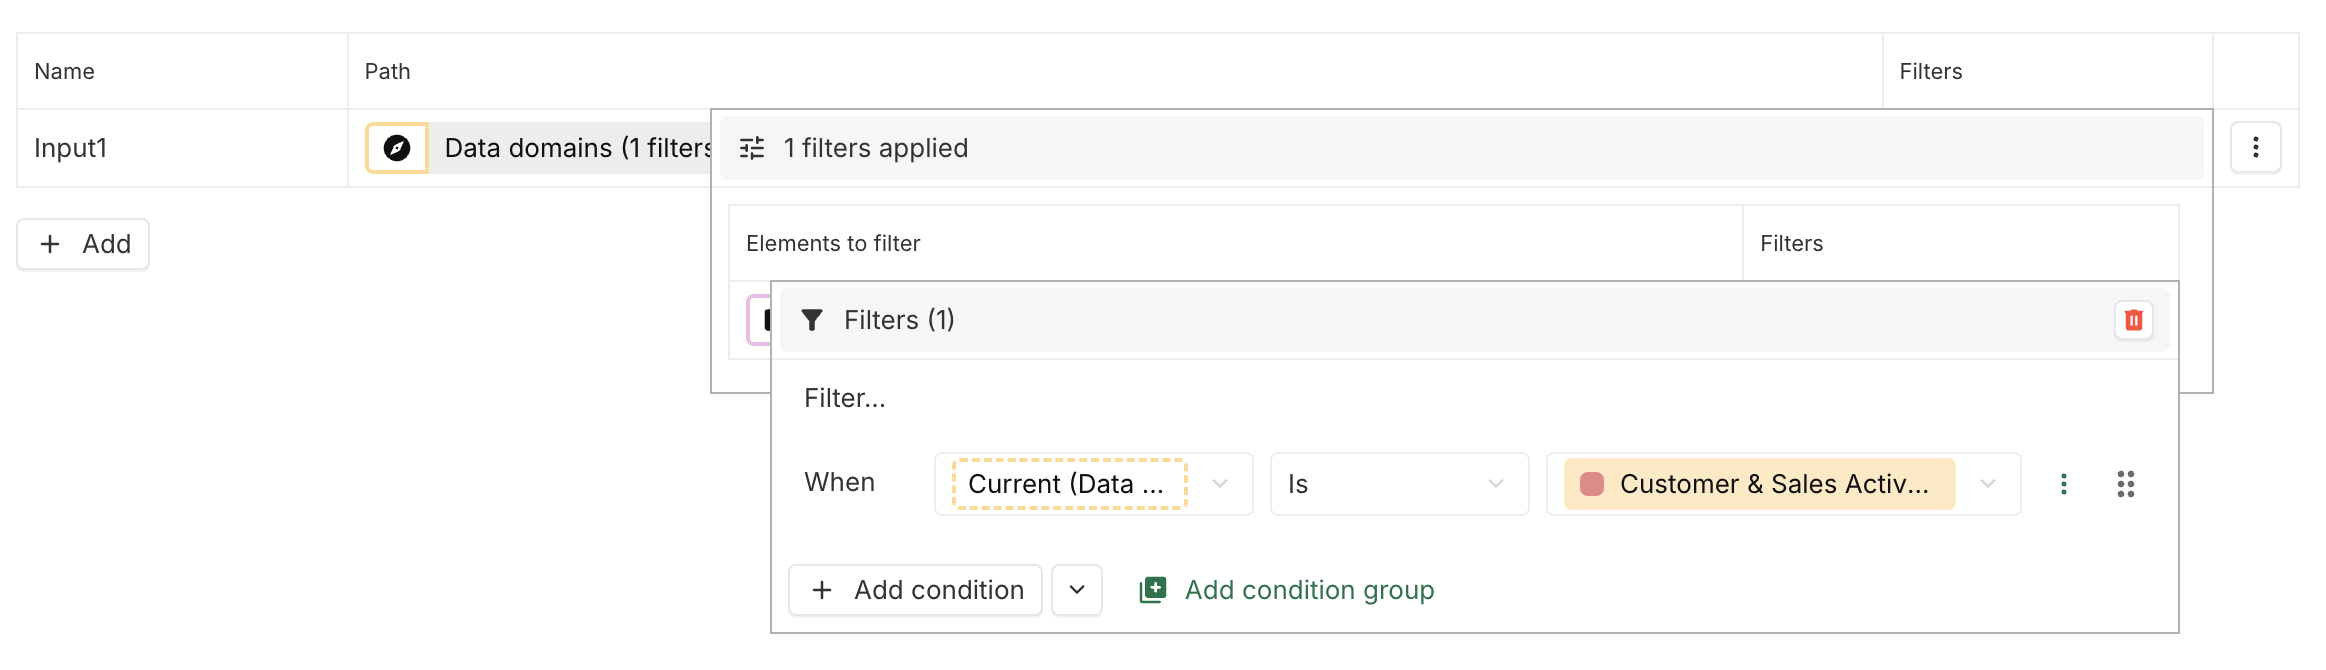
It is then possible to use this input like this:
IF(COUNT(Input1)=1, DoSomething, DoSomethingElse)Check whether the value contains only given instances
To check if the field Data domain (Association n-n) contains the instance Customer & Sales Activation and Facilities & Sites and no other instances, a filter needs to be set on the input:
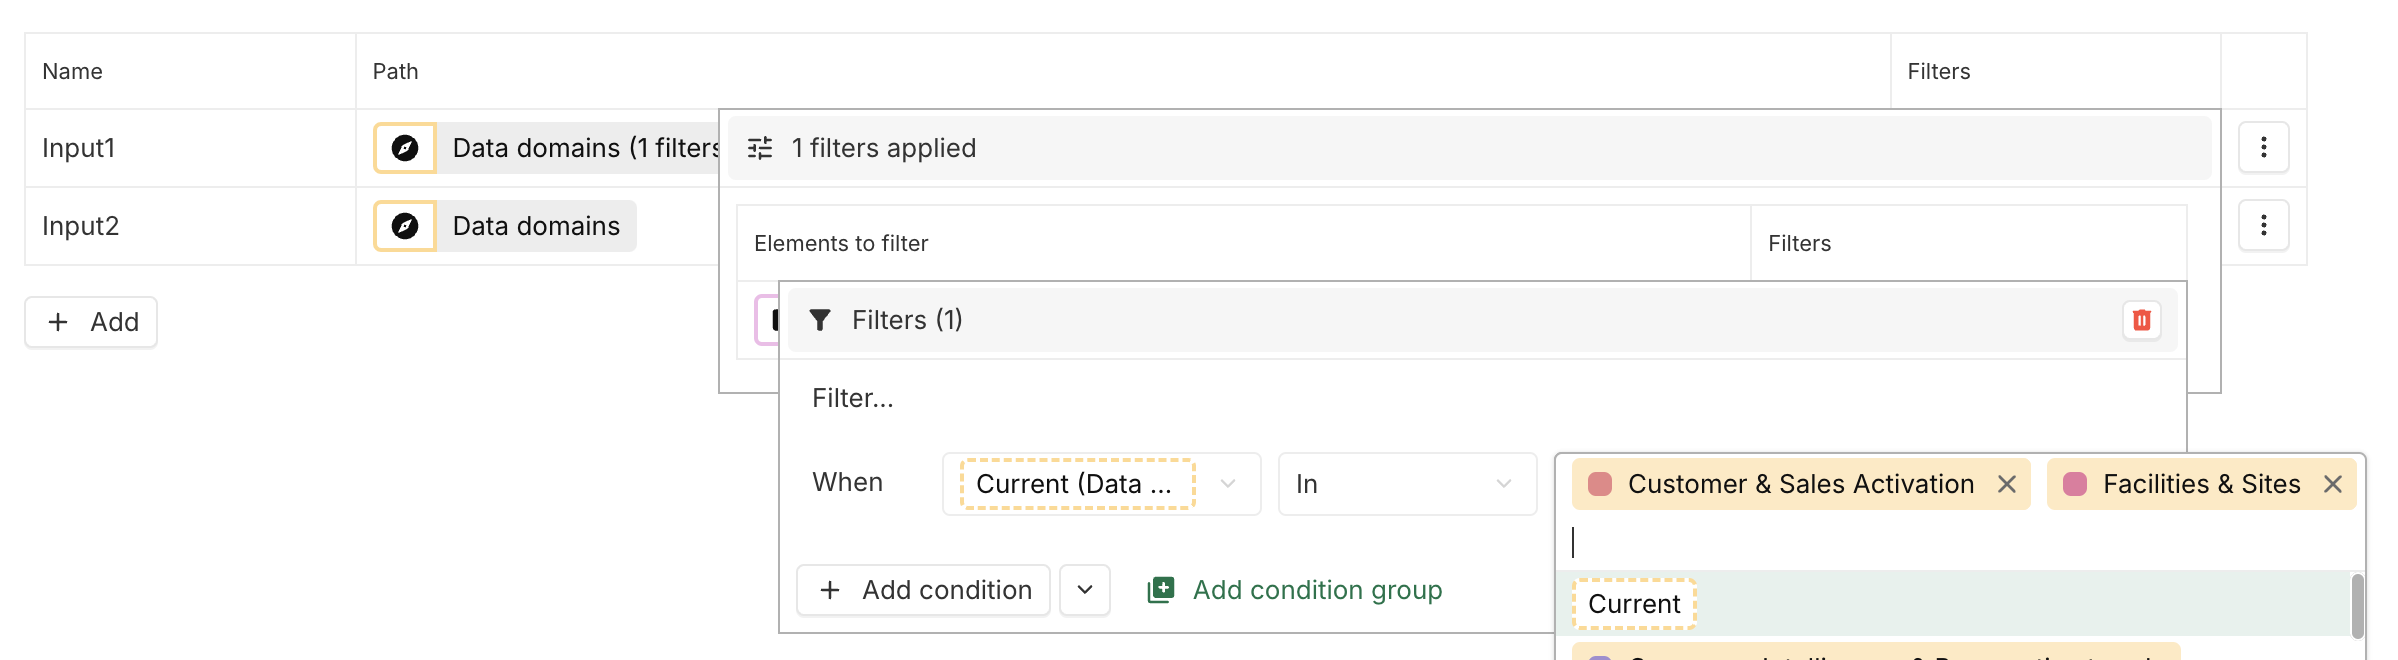
And an input without filters also needs to be defined:

It is then possible to use inputs like this:
IF(AND(COUNT(Input1)=2, COUNT(Input2)=2), DoSomething, DoSomethingElse)Reuse filters on instances
For reasons of performance and practicality, it may be useful to create a calculated association n-n representing a subset of given instances.
Let's imagine, for example, that the average of different indicators for a given set of instances needs to be calculated. The classic way will be to have for each indicator:
- As Input: Use case > All instances (filters) > Indicator X.
And then do:
AVERAGE(Input)In this case, it can be interesting to create a computed n-n association representing the subset of instances:
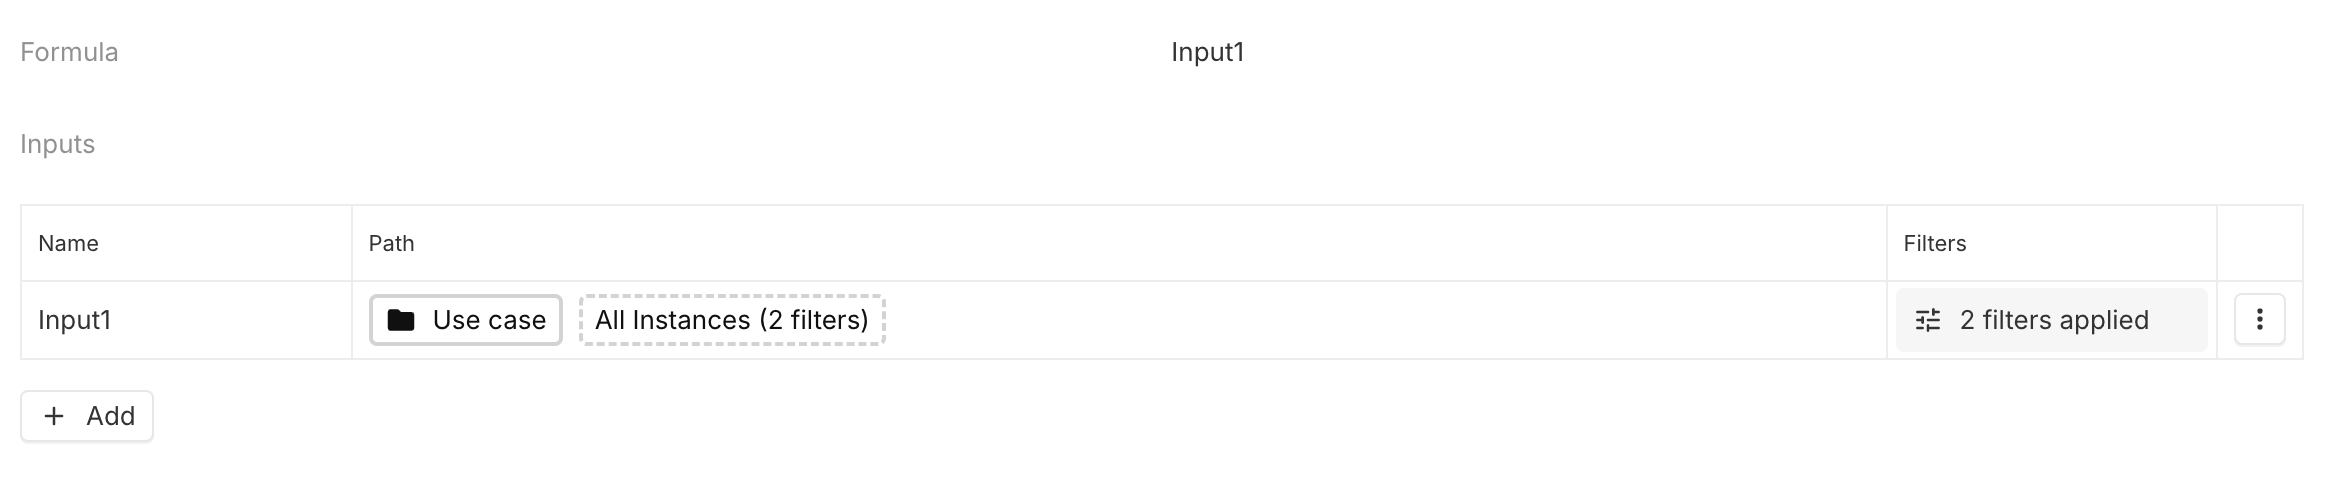
And then use this computed association n-n for the computed number representing the average of the indicator:

It is interesting in two ways:
- Performances: If several indicators are represented on a Dashboard, for example, the filter will only be calculated once, which will result in a significant gain in performance if the number of instances to be filtered is large.
- Practicality: If changes need to be made to the filter, they will only need to be made in one place.
Work with dates
Add time to a date
In this example, a computed date needs to be defined by adding Estimated Time Frame (a number, which represents a number of weeks) to a date (Predicted Starting date).

To do so, the number of weeks needs to be transformed into the number of milliseconds representing those weeks, and this number of milliseconds needs to be added to the starting date. Furthermore, when the Predicted Starting date or the Estimated Time Frame is NULL, the computed date is set to NULL:
IF(OR(Input2=NULL, Input1=NULL), NULL, DATE.ADD(Input2, "week", Input1))Get today's date
To get today’s date, it is possible to do:
NOW.DAY()Check whether an instance was created this week
To check if an instance has been created this week, the formula below can be used:
IF(DATE("day", Input1) + WEEKDAY(NOW(), 2)*1000*3600*24 > NOW(), TRUE, FALSE)By Input1 being the Created at date.
The formula will return TRUE for any instance created since Monday.
Format dates in text fields
Dates can be formatted dynamically within text fields using the TEXT function, which allows full control over how dates are displayed. This function works similarly to Excel’s TEXT function and takes a DATEVALUE(Date) as input along with a formatting pattern. For example, it can be used to generate labels such as:
W16 2026 (From April 13, 2026 to April 19, 2026)
The formatting syntax follows standard conventions (see Microsoft documentation), making it possible to display weeks, months, or full date ranges in a readable format.
In cases where a specific format is not directly supported, custom logic can be implemented using formulas. For example, a quarter label can be derived from a date using:
CONCATENATE( "Q", ROUNDUP(MONTH(Input1)/3,0), "-", YEAR(Input1))For an input date such as April 13, 2026, this formula would return:
Q2-2026
This approach provides flexibility to construct advanced date representations when standard formatting options are insufficient.
Work with timeseries
Create a cumulative timeseries
It is possible to get a cumulative timeseries from a timeseries input in a very simple way:
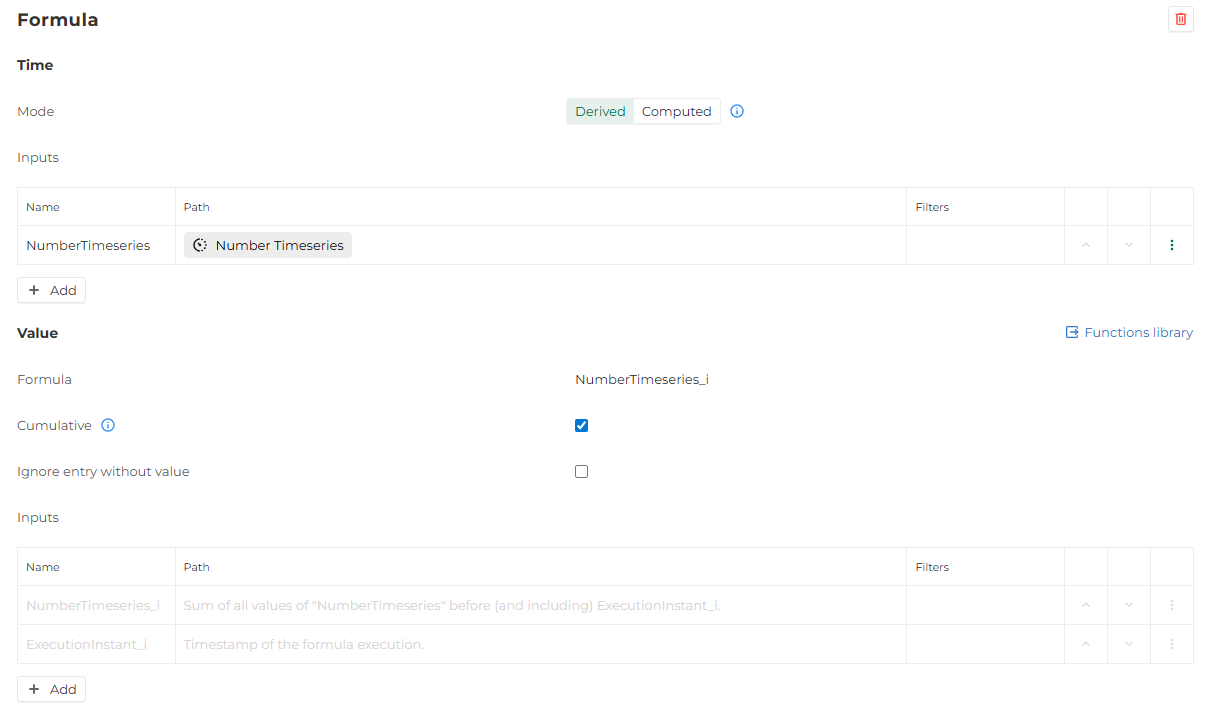
- Create a computed timeseries of the sum (see Sum timeseries).
- Create a computed cumulative timeseries from the timeseries of the sum, as shown above.
Sum timeseries
Sum timeseries as a timeseries
It is possible to create a computed timeseries representing the sum of some timeseries doing this:
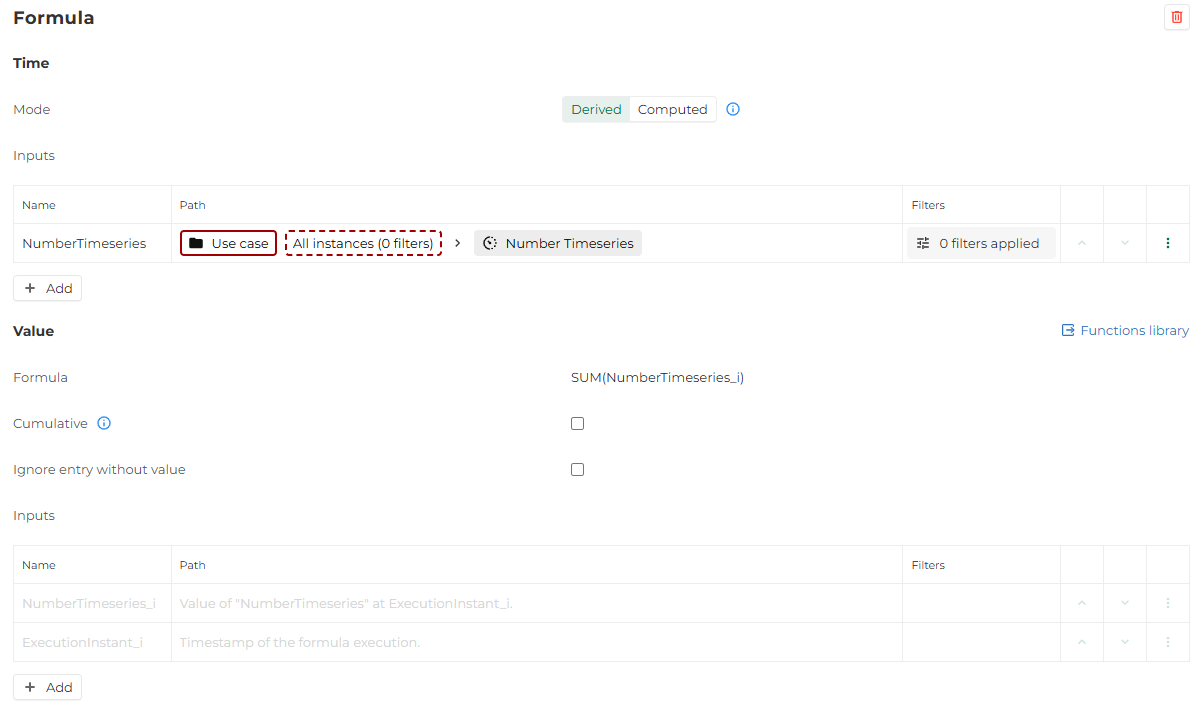
The resulting timeseries will have for dates all the dates from the timeseries of the input.
For example, if there are three Use cases that have for timeseries (periodicity yearly) the ones below:
Use case 1 timeseries:
| Date | Value |
|---|---|
| 2023 | 10 |
| 2024 | 12 |
| 2025 | 8 |
Use case 2 timeseries:
| Date | Value |
|---|---|
| 2024 | 4 |
| 2025 | 6 |
Use case 3 timeseries:
| Date | Value |
|---|---|
| 2027 | 2 |
| 2028 | 5 |
The computed timeseries (periodicity yearly) will be:
| Date | Value |
|---|---|
| 2023 | 10 |
| 2024 | 16 |
| 2025 | 14 |
| 2027 | 2 |
| 2028 | 5 |
Sum timeseries as a number
It is possible to have a number representing the sum of all (or some) of the values of a given timeseries, using the VALUESIN function:
SUM(VALUESIN(Input))VALUESIN only accepts a single timeseries, and not an array of timeseries. Therefore, Input should have a cardinality 1.To sum multiple timeseries for all dates, it must be done in two steps:
- Create a computed timeseries of the sum.
- Create a computed number using the computed timeseries as input.
Compare timeseries
It is possible to compare timeseries. There are two ways of doing it that can lead to a different result. There is no better way, it depends on what needs to be achieved.
To illustrate, an example will be taken in which a comparison will be made between the values of a timeseries given a reference timeseries.
The reference timeseries is the following:
| Date | Value |
|---|---|
| 2023 | 90 |
| 2024 | 110 |
| 2025 | 130 |
| 2026 | 120 |
The timeseries that is compared to the reference timeseries is the following:
| Date | Value |
|---|---|
| 2024 | 100 |
| 2025 | 140 |
Use one timeseries as the time reference
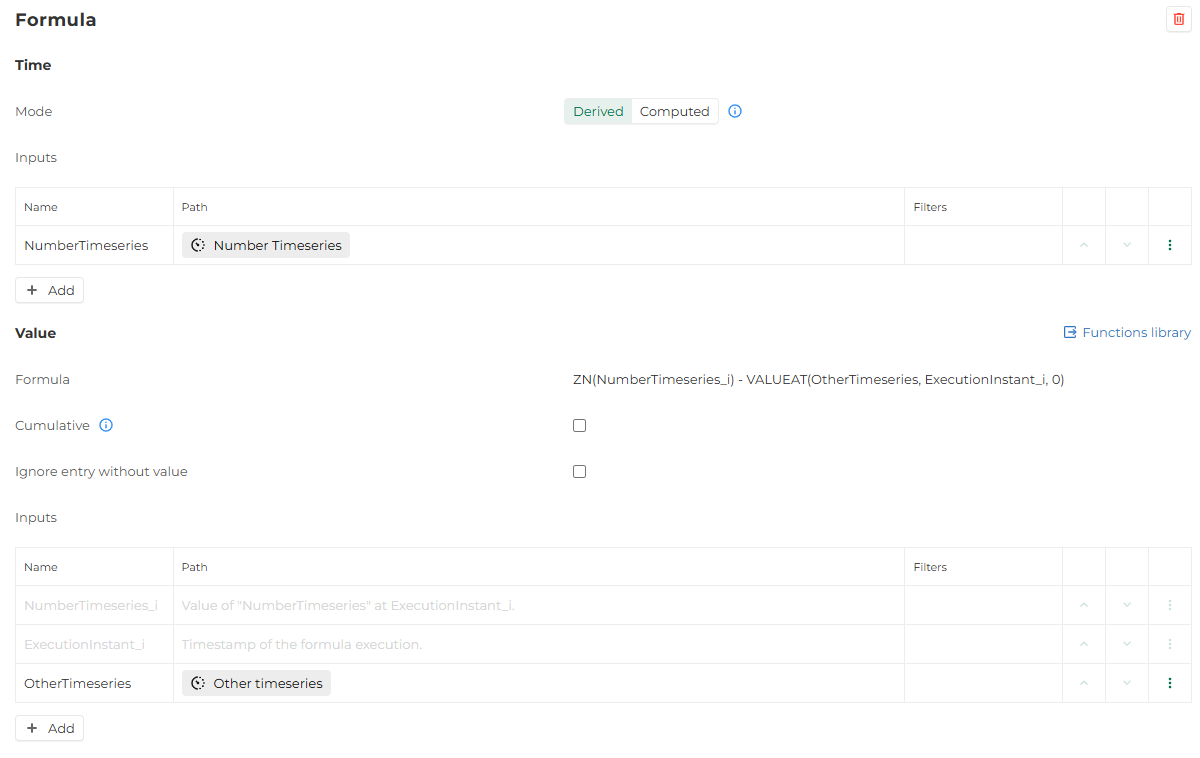
With this computing, the result will be the following:
| Date | Value |
|---|---|
| 2024 | -10 |
| 2025 | 10 |
Only the dates of the Input1 are used for the computed timeseries. We are able to retrieve the values of the reference timeseries by using the VALUEAT function and the parameter ExecutionInstant_i.
Use both timeseries as the time reference
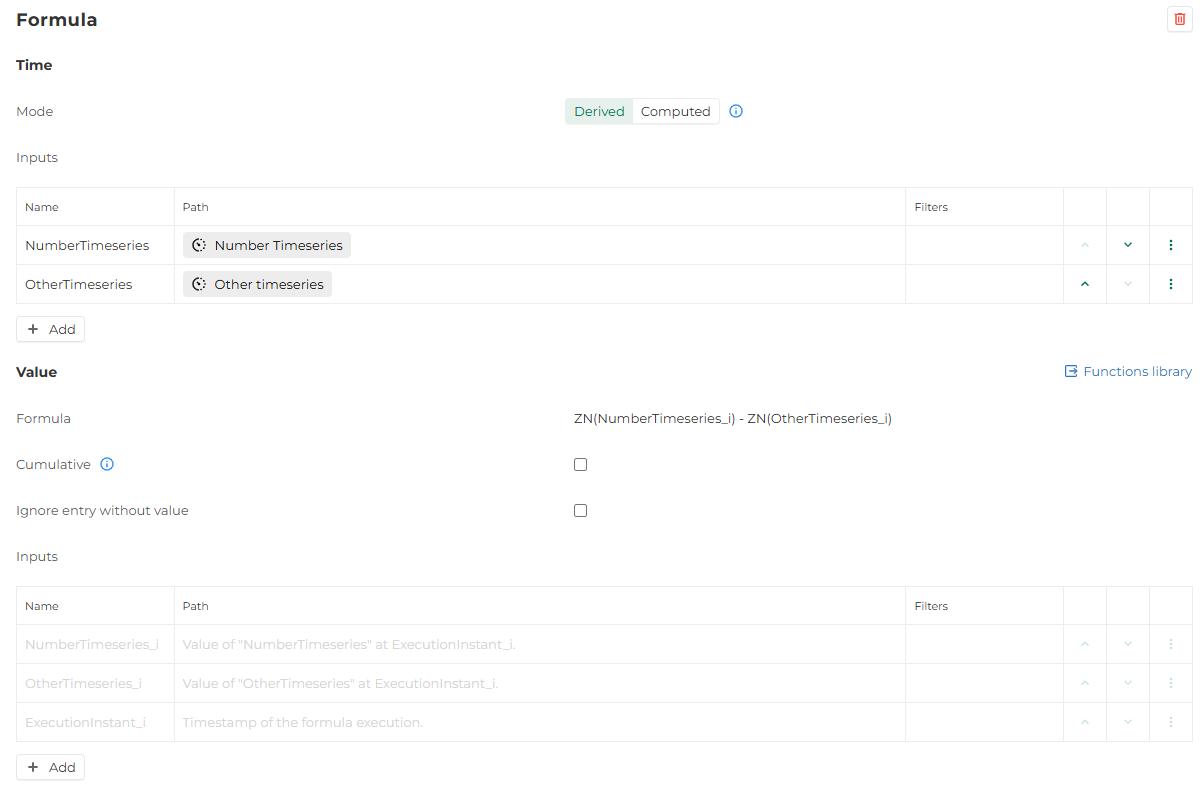
With this computing, the result will be the following:
| Date | Value |
|---|---|
| 2023 | -90 |
| 2024 | -10 |
| 2025 | 10 |
| 2026 | -120 |
All the dates found both in Input1 and Input2 are used for the computed timeseries.
Define computed boolean fields
For boolean field computed, TRUE, FALSE or NULL (will be considered as FALSE) needs to be returned by the formula. It can be done in several ways:
- Using
TRUE,FALSEorNULLdirectly.
- Making a formula that generates a boolean (
TRUEorFALSE) orNULL. For example:Input1 > 50generates aTRUEorFALSEbased on the value of Input1.
As a reminder, booleans can be used in formulas as input, these inputs return TRUE or FALSE.